Dwell Time Tracker
Timeline
September 2019 - September 2021
(2 years, intermittent)
Tools
JDA Supply Chain Planning
Microsoft Excel
Visual Basic
Role
Research and design
The Problem
Warehouse operators had discovered weaknesses in the existing productivity system, allowing them to leave their posts for extended periods of time and still appear to be meeting the productivity goal.
Findings
- 6.25% of operators on a given day had unacceptable levels of dwell time
- 8.75% of operators were repeat offenders (three or more times a month)
- 367.5 hours of non-productive wages paid per week on average
- $2,973,750 was the annual cost of non-productive hours
- Factoring in overtime, total costs of excessive Dwell Time were estimated at $7 million
Research
User Groups
Key users and stakeholders included Shift Supervisors, Team Leads, and the Training Lead. Interviewing them led to a variety of qualitative data.
Ethnographic Studies
Observing Warehouse Operators in the field allowed me to time their assigned tasks and observe their habits.
Analyzing Inventory Data
The supply chain system kept a record of all timestamps recorded by the onboard computers of all warehouse operators.
Stakeholders and User Groups
Team Leads
Directly monitorizing the operators in their departments, Team Leads were most interested in knowing when operators were straying from their tasks and falsley using the override function on their onboard computer.
Supervisors
Directly monitorizing the operators in their departments, Team Leads were most interested in knowing when operators were straying from their tasks and falsley using the override function on their onboard computer.
Training Lead
Directly monitorizing the operators in their departments, Team Leads were most interested in knowing when operators were straying from their tasks and falsley using the override function on their onboard computer.
Task Flows
The Full Pallets task is an operation where a reach truck driver pulls two full pallets of product from the warehouse, carries them in a stack to a printer, applies shipping paperwork, and takes the pallets to the appropriate shipping lanes where they will be loaded on to a trailer.
It is one of the most common tasks for stand up reach truck drivers.

The Putaway task is the counterpart to Full Pallets. A reach truck driver takes a stack of two pallets to stock into emplty slots within the warehouse.
Full Pallet and Putaway operators combined account for 75% of all reach truck functions, so these task flows were heavily factored into time studies.

Define
Operators were subverting the productivity system
One example would be overriding the onboard computer to tell it a much greater distance had been traveled to complete a task than necessary.
This would allow an operator to to have more dwell time, but still appear to be productive.
How was this being addressed?
Team Leads suspecting an operator of false productivy could print out timestamps from the inventory system.
Looking through the inventory transactions manually on paper was time consuming for the Team Leads.
It was not possible to regularly conduct such investigations.
Design
Functional Proof of Concept
I learned that the timestamp data was available in Comma Separated Values (CSV). I made modifications to how the data was output and within hours I had a working proof of concept.
Column A: This is a list of all the timestamps generated in a shift by a single employee.
Column B: The calculated time difference between each time stamp in Column A.
Column C: For every time the number in Column B was bigger than 10 minutes, it was recalled here. This allowed me to use the COUNT function and see how many occurences there were, as well as add up the total time of these occurrences.

The initial version was just three columns of numbers pulled from comma separated values and strung together with a little Visual Basic code.
This wasn't about being punitive for every trip to the restroom or watercooler.
This was about discovering employees that were absent for HOURS
Time Studies

The total task takes an estimated 5 minutes, 4 seconds to complete. However, the average time between time stamps is 60.83 seconds.
10 Minutes as a Dwell Time benchmark
With the longest subtask estimated at two minutes, an operator would have to take five times as long to generate a single dwell time occurrence.
Unexpected things can occur during the course of a task. However, an operator would have to have 19 such occurrences at 10 minutes each in order to exceed the acceptable threshold.
In discussions with Supervisors and the Training Lead, it was determined that there was no task that could not be completed in 10 minutes.
How It Worked
Timestamps were downloaded as Comma Separated Values into a individual sheets into a Binary Spreadsheet.
The Binary Spreadsheet was linked to a Master Load Spreadsheet, in which individual reports were calculated.
Individual Dwell Time Reports were fed into a shift compiler sheet where the data could be sorted and adjusted out if necessary.
The sorted data was fed into a shift report that made calculations about the shift dwell time as a whole.

Testing
The initial tests were run on third shift in a single building. The proof of concept was tested with a handful of randomly chosen operators. Further testing went on to include all third shift operators in a single facility, and eventually all operators within that facility.
Supervisors, Team Leads, and the Training Lead were all instrumental in confirming the accuracy of the dwell time calculations.
Supervisors
In addition to discovering operators with lots of dwell time, Supervisors used the opportunity to reward operators who had minimal amounts of dwell time.
When the process for running Dwell Time Reports decreased in speed, the Supervisors authorized running reports on all operators in the building.
Team Leads
Team Leads often requested a Dwell Time Report be run on individuals that did not seem to be working up to the standard. If the Dwell Time Report proved an individual had excessive dwell time, it was forwarded to the Supervisors.
Training Lead
Training Leads were responsible for retraining any individuals that were not hitting the specified productivity rate.
Training Leads often shared an operator's dwell time report with them to illustrate the opportunities for improvement throughout the shift.
Ideate
Once the intial goal was met, streamling the process of identifying dwell time, we realized there was much more data accompanying the timestamps and it could offer other observations.
What else did the data say?
Each timestamp also told a story.
Function: Reason for product being moved
Product to RF: The barcode of product being scanned to the onboard RF computer
Product from RF: Barcodes scanned to the RF that were being relabeled or printed
From Location: Where specifically in the warehouse the barcoded product was obtained
To Location: Where specifically the barcoded product was being deposited.
This additional data would be instrumental in adding features to the dwell time report.

An example of raw data convereted from CSV and exported to Excel
Positive Reinforcement
Althought the purpose of the Dwell Time Tracker was initially to find operators with excessive amounts of dwell time, it was also useful in discovering the most productive workers.
The two operators with the least amount of dwell time on shift were rewarded with points that could be redeemed for company products, swag, or food items from the vending area.
Fair and Even Evaluation
When Team Leads were using highlighters to determine if operators were neglecting their duties, the Leads faced the possibility of unfairly targetting an operator.
With the advent of the Dwell Time Tracker, we could quickly run a report on every operator so as not to single out any one individual.
To be clear, this wasn't about being punitive for every trip to the restroom or watercooler. This was about discovering employees that were absent for hours.
Example Dwell Time Report and Added Features


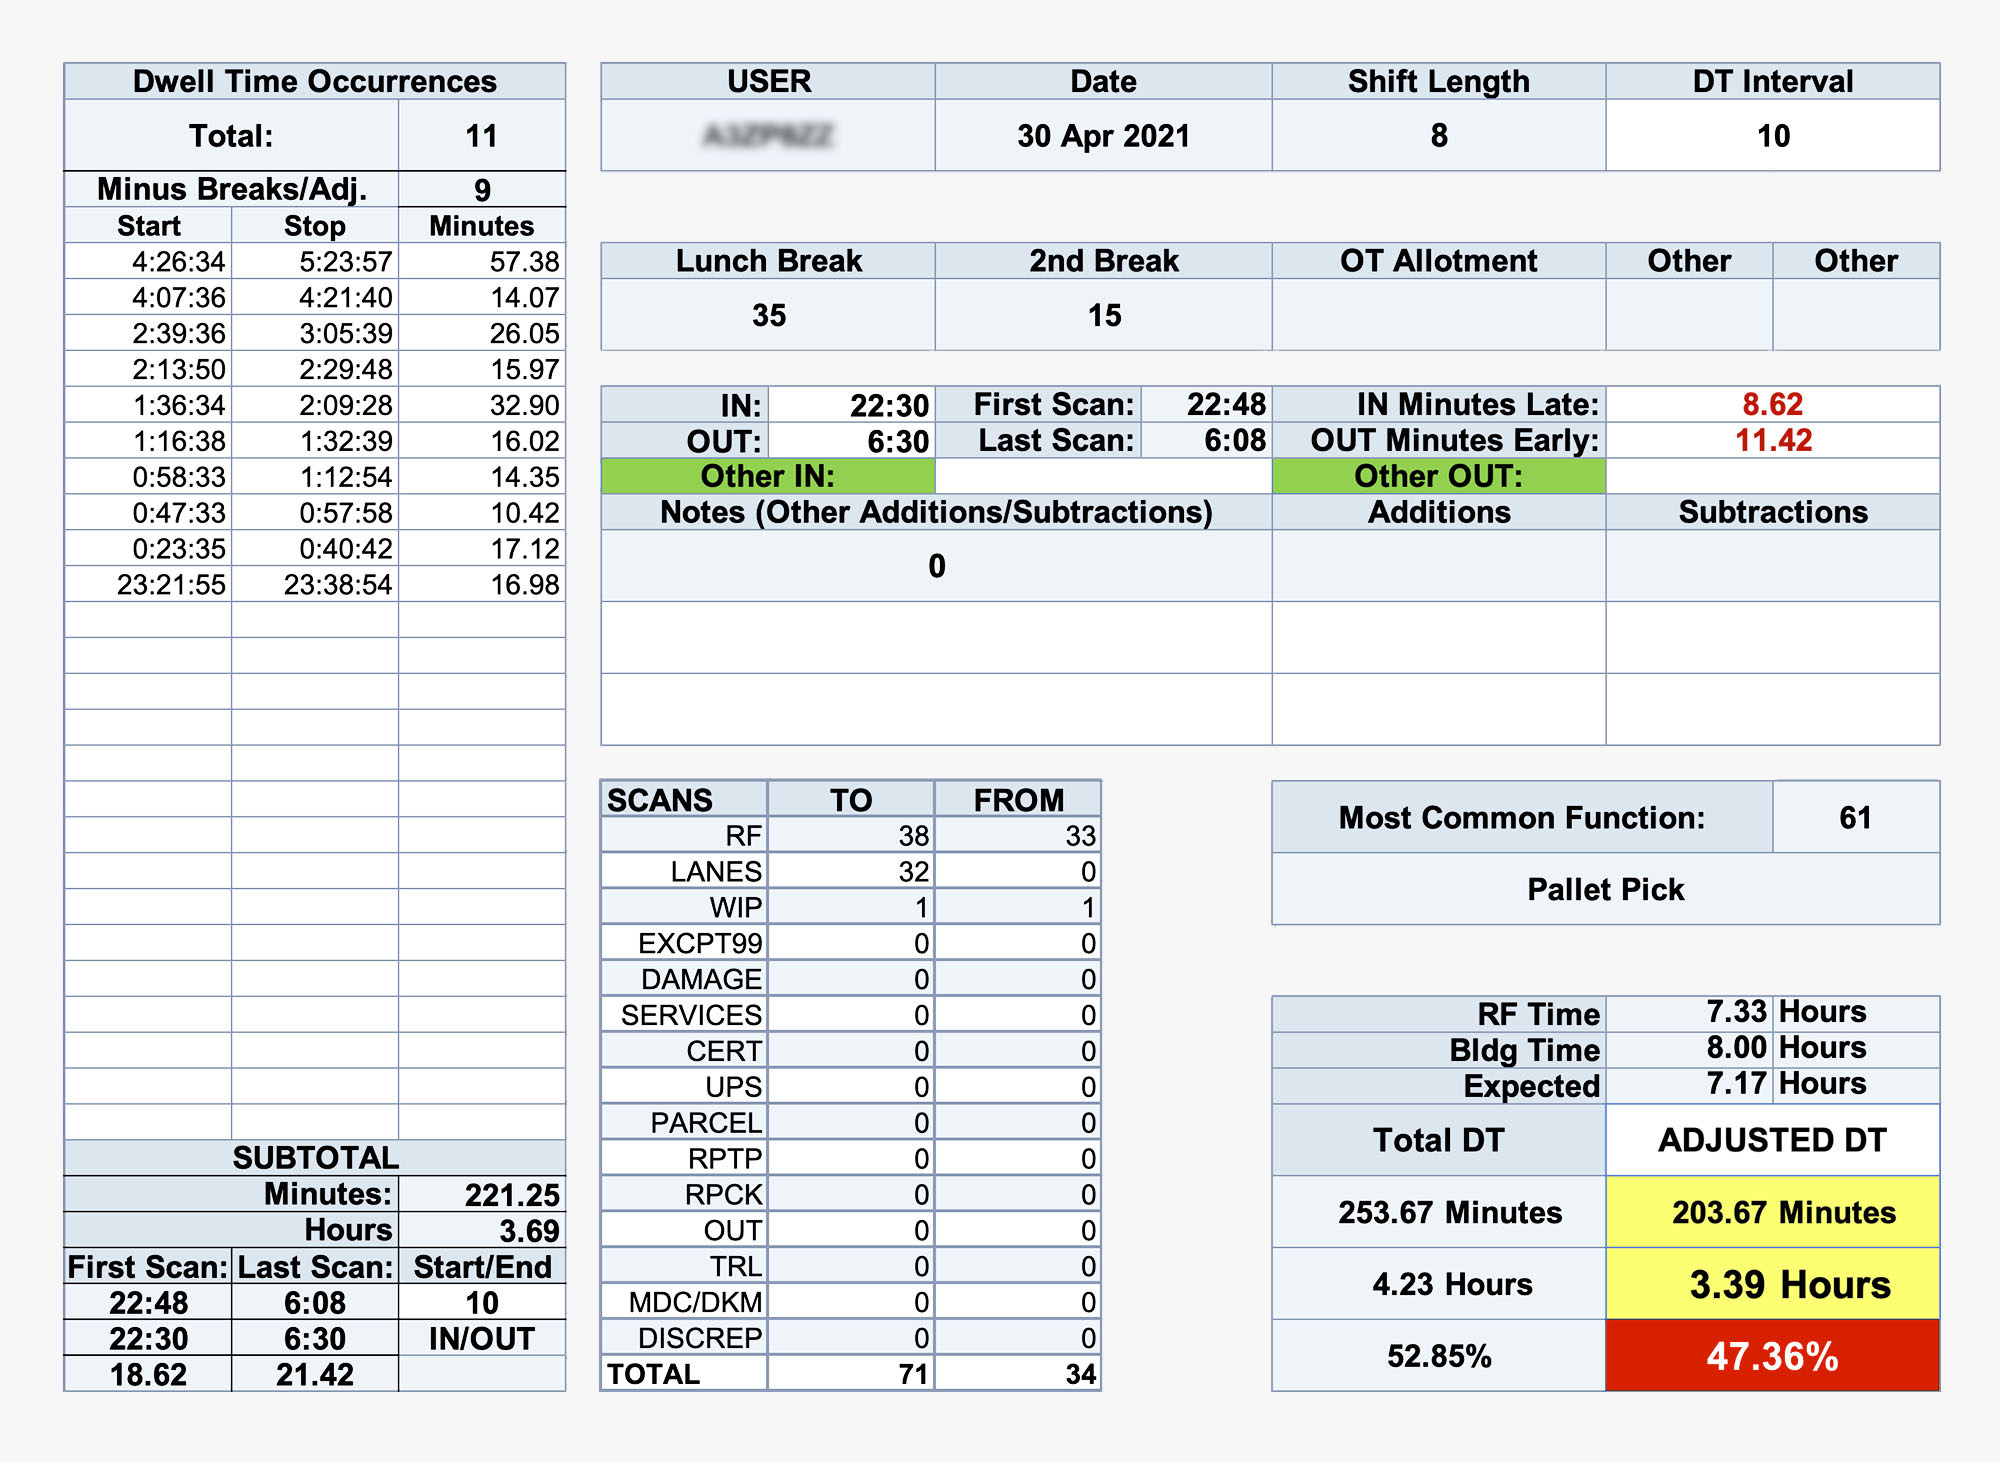
1. Dwell Time Occurrences
A list of all dwell times greater than the specificed time interval, usually 10 minutes.
This is close to what the earliest proof of concept resembled.
2. Shift Lenth/Dwell Time Interval
This block includes the user ID, date, shift length, and dwell time interval to check.
The shift length is important because operators that work overtime are granted additional breaks.
3. Auto Approved Breaks
These breaks are automatically generated based on the length of a shift. Break lengths are deducted from overall dwell time.
If this operator earned extra break time by workingf overtime, it would show up under "OT Allotment"
4. In/Out Times
Based on first and last scans, this determines when an operator should have clocked in or out.
At the start and end of each shift the operator has 10 minutes to prep and cleanup. This section also determines if an operator was late to start or early to finish. This operator was both.
5. Manual Adjustments
It is sometimes necessary to make manual adjustments to an operator's dwell time if they are working on a sepcial project or in a particular function.
The shaded area is where a global adjustment would appear if all employees were granted and adjustment across the board. This might happen if there were an extra break awarded or the system went down for an extended period of time.
6. Location Scans
This is a mini-report of locations that an operator scanned throughout a shift. This can help to indicate if an employee was working on the correct task.
In this case, the employee scanned 32 full pallets to lanes to be shipped. An operator assigned to shipping full pallets should accomplish about 70 pallets in a night. 80+ is possible.
7. Assigned Function
This is an indicator of what function the operator was executing most often. It should align with the function that they were assigned on the shift schedule.
8. Adjusted Dwell Time
This shows the operator dwell time, totals and adjusted after breaks, in minutes, hours, and as a percentage of their shift.
The initial threshold for alerting a supervisor was generously set at a dwell time of 45%, meaning an employee was not working 45% of the time.
Subsequent versions complied additional data, and allowed supervisors to get a look at downtime averages on a daily, weekly, and monthly basis per shift. This kind of data had never been available in a report prior to this.
Prototypes evolved rapidly. Macros were written. Processes were automated. The product went from tracking 80 employees on one shift, to tracking over 240 employees across four shifts.
Key Takeaways
A Few Bad Apples
Operators with excessive dwell time accounted for about 6.25% of operators on a given shift (about 5 operators). The majority of offenders on a given day were all repeat offenders.
About 8.75% of all operators were likely to have excessive dwell time more than 3 times a month.
It Adds Up
Although most of the dwell time came from a small amount of people, it added up quickly.
An aveage of 367.5 hours per week of non-productive hours had real consequences for a fast paced logistics environment.
Everyone Has Some Dwell Time
Plotting the numbers of operators at specific intervals of dwell time as a percentage of their shift produces the well known bell curve.
Dwell time might be caused when an operator spills a pallet of product and others stop to help clean up. It might be caused when product becomes stuck in a rack or a barcode is missing from a pallet.
The goal is to reduce dwell time wherever possible. The projected graph shows how dwell time distribution might look if behaviors were changed so that one one was above the 45% threshold.
Well, Almost Everyone
One particularly productive employee proved it was possible to have negative dwell time.
He accomplished this while trying to set a personal record. This was only made possible by the fact that he left lunch early (of his own will and at no one's suggestion), so when the break was deducted from his accumulated dwell time, the result was negative. This was a rare occurence that happened just once.


Non-Productive hours led to:
Scheduled overtime most Saturdays
10-hr shifts vs. 8-hr during the week
A deficit in hours that was difficult to overcome
Low employee morale
Conclusion
From 4-hour proof of concept to 2-year pilot program
This pilot version was used by a variety of supervisors and team leads from September 2019 to September 2021. During that time I met with the campus liason, one training lead, two supervisors and three engineers demonstrating the concept.
My involvement officially eneded in October 2021 when I took on a new role with the company.
The engineers on site adapted the concepts and features of the pilot product and re-implemented them with Microsoft Power BI reports.
In April 2022, I left the company to follow other pursuits. Former colleagues report that the latest iteration of the Dwell Time Tracker is still used by supvervisors to keep tabs on excessive dwell time from operators.
The current iteration is now available to use in four distribution facilities.
Note: Some aspects of this product have been redacted or changed so as to avoid the least bit of impropriety regarding Non-Disclosure agreements with my former employer. As such, I am not able to provide any code or work product.
UX Case Studies
© 2023 John Everett Morton. Built with Semplice and Wordpress.